


Editorial: Does the Epic fairly represent the community?
November 9, 2021
As part of our ongoing effort to promote diversity, equity and inclusion, the Epic is taking a look at our diversity statistics from the past four school years, 2017-21. Diversity in coverage includes but is not limited to: race and ethnicity, age, sex and grade. In hopes of providing inclusive coverage to all students, staff, sports, clubs and groups on campus, we have audited our previous issues to reveal both our successes and shortcomings in equitably representing the Lynbrook population and promoting diversity. We chose to share these numbers with the wider community not only to keep the Epic accountable but also to share our goals as a publication and demonstrate the impact that our readers have in shaping our content. We would like to note that this data only includes our print coverage and does not take into account our web-exclusive content or continuous coverage on social media.
the Epic’s staff demographics
the Epic’s staff is composed of more females than males, largely because we receive more female applicants. To account for this, we will continue to advertise the application to our publication through annual presentations to freshman and sophomore literature classes and social media posts in hopes of attracting a larger male audience.


Student interviews
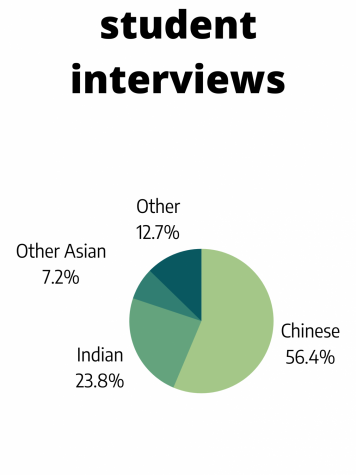
From 2018-21, Lynbrook has hosted a predominantly Asian Indian and Chinese student population. Using a chi-squared goodness-of-fit test based on the data show in Figure 2.1, the result was p-values less than the 0.05 alpha level. A higher p-value, ideally above 0.05, indicates that date is more representative of the group it is sampled from. As our p-values fall significantly below that number, our data does not match that of our student population. 75% of the Lynbrook population is Chinese and Indian, while 80.2% of our interviewees are of these two ethnicities, meaning we have room for growth.
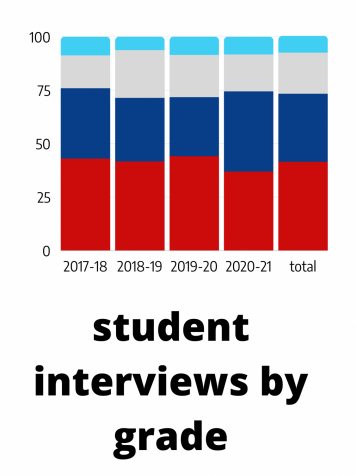
Based on statistics released by FUHSD, Lynbrook’s class sizes are nearly equal across all grades. In our interviews, we interviewed seniors and juniors more often than sophomores and freshmen. In fact, more than 73% of our interviewees were upperclassmen. However, we would like to acknowledge that most club officers and group leadership positions are held by juniors and seniors. Regardless, we aim to balance this disparity by increasing coverage of underclassmen events such as Link Crew and JV sports.
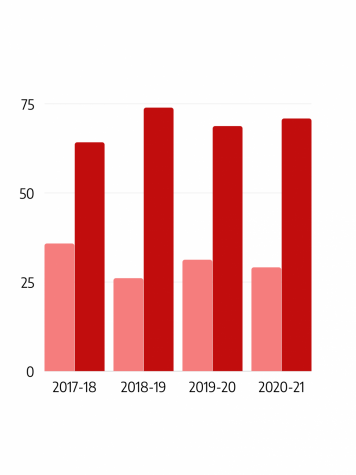
Lynbrook has a 52-48% split between male and female students. Our data, shown in Figure 2.2, indicates that we lean significantly toward female interviewees, with only 30% of our interviewees identifying as male. This year, we will work to better represent the Lynbrook population by being more mindful of interviewing students of both sexes and contacting potential interviewees. For example, we plan to post Instagram polls about future story topics and direct message students who voluntarily respond. This way, we can quote anyone who demonstrates an interest in giving their opinion on the subject and wants to have their voice shared through the Epic.
Staff interviews

Figure 3.1 shows our top-covered departments with respect to staff interviewees. We have interviewed staff from the school administration 54 times, the social studies department 41 times, the English department 37 times, the guidance department 29 times and the science department 26 times.
It is important to note that the data on these staff interviews often reflects the content of the stories we choose to write and publish. the Epic, being a news publication, covers current events. Many timely and relevant issues are associated with social justice and national headlines, which are often the expertise of staff in the history department. Nonetheless, we are seeking to diversify the topics of our articles and cover more than history, the government and current events. We plan to highlight the use of “beats,” a system to stay informed about all relevant communities in the Lynbrook community, to allow for a deeper and more comprehensive set of topics.
Distribution by race/ethnicity
From 2018-21, Lynbrook has hosted a predominantly Asian Indian and Chinese student population. Using a chi-squared goodness-of-fit test, a statistical test to determine the probability of achieving a distribution by chance, the result was p-values less than the 0.05 alpha level. A higher p-value, ideally above 0.05, indicates that date is more representative of the group it is sampled from. As our p-values fall significantly below that number, our data does not match that of our student population. 75% of the Lynbrook population is Chinese and Indian, while 80.2% of our interviewees are of these two ethnicities, meaning we have room for growth.
Clubs and groups
Of the 84 groups and clubs on campus, we have featured 37 unique ones across all four years. However, some notable clubs and groups, including ASB, Science Olympiad and Intersections, are mentioned at least four times, while others are mentioned at most three times. Although some clubs naturally contribute more toward campus culture or generate more newsworthy events, we strive to increase coverage to less widely known clubs by emphasizing “beats” to stay in constant contact with officers from every club on campus. To compensate for any further disparities, we will increase social media coverage for these clubs in the form of quick turnaround media.
Sports
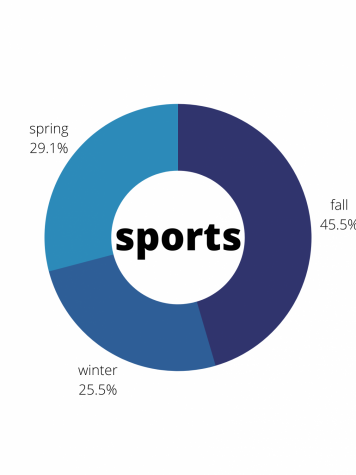
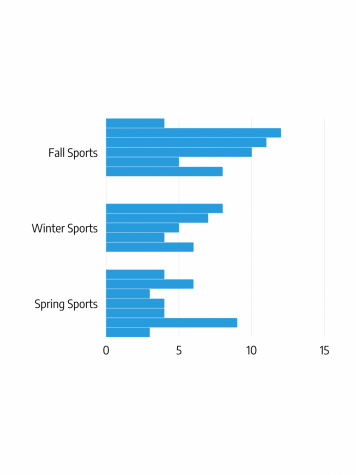
Lynbrook hosts seven fall sports, three winter sports and nine spring sports in addition to a few year-round sports. Of these sports, nine are girls sports, 12 are boys sports and four are coed. Based on the bar chart in Figure 4.2, which excludes any social media or web-exclusive photo coverage, we cover fall sports markedly more than other seasons. We have also featured certain popular sports a disproportionately high number of times: These include field hockey, cross country, football and swimming and diving.
However, the distribution of boys, girls and coed sports coverage is very similar, with 39.7% being girls, 38.8% being boys and 21.5% being coed. This year, we are continuing to step up our equitable sports coverage by creating a recurring sports photo spreadsheet to provide continuous coverage of Lynbrook athletics, both online and in print. We record dates of games and tournaments for each sport upon release and encourage staffers to photograph and interview players.
the Epic is constantly working toward equitable coverage of Lynbrook’s student and staff population. By interviewing community members with various experiences and of different races, genders and backgrounds, we aim to provide complete and nuanced perspectives on relevant issues to the Lynbrook community. Conducting this diversity audit on our own processes has brought to light discrepancies that we pledge to correct in the future. Through concrete methods such as maintaining an interviewee blacklist, implementing a post-issue diversity analysis at least once a semester and holding open critique sessions to attain candid feedback from students and staff on campus, we will continue being transparent with our dedication to reporting on the Lynbrook community.